


Results of the analysis show that reliance on improvement of energy efficiency combined with CCUS and NETs alone is unlikely to be a cost-effective path for deep decarbonization of China’s HTA sectors, especially heavy industries. More specifically, widespread application of clean hydrogen in HTA sectors can help China achieve carbon neutrality cost effectively compared with a scenario without clean hydrogen production and use. The results provide strong guidance for China’s HTA decarbonization pathway and a valuable reference for other countries facing similar challenges.
Decarbonizing HTA industrial sectors with clean hydrogen
We carry out an integrated least-cost optimization of mitigation pathways to carbon neutrality for China in 2060. Four modelling scenarios are defined in Table 1: business as usual (BAU), China’s Nationally Determined Contributions under the Paris Agreement (NDC), net-zero emissions with no-hydrogen applications (ZERO-NH) and net-zero emissions with clean hydrogen (ZERO-H). HTA sectors in this study include industrial production of cement, iron and steel and key chemicals (including ammonia, soda and caustic soda) and heavy-duty transport, including trucking and domestic shipping. Full details are provided in the Methods section and Supplementary Notes 1–5. Regarding the iron and steel sector, the dominant share of existing production in China (89.6%) is by the basic oxygen-blast furnace process, a key challenge for deep decarbonization of this
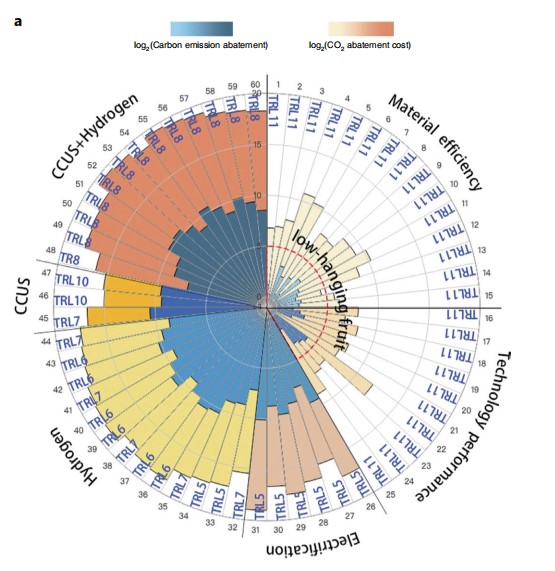
industry. The electric arc furnace process comprised only 10.4% of total production in China in 2019, which is 17.5% less than the world average share and 59.3% less than that for the United States18. We analysed 60 key steelmaking emissions mitigation technologies in the model and classified them into six categories (Fig. 2a): improvement of material efficiency, advanced technology performance, electrification, CCUS, green hydrogen and blue hydrogen (Supplementary Table 1). Comparing the system cost optimizations of ZERO-H with NDC and ZERO-NH scenarios shows that inclusion of clean hydrogen options would yield notable carbon reduction due to introduction of hydrogen-direct reduction of iron (hydrogen-DRI) processes. Note that hydrogen can serve not only as an energy source in steelmaking but also as a carbon-abating reducing agent on a supplementary basis in the Blast Furnance-Basic Oxygen Furnance (BF-BOF) process and 100% in the hydrogen-DRI route. Under ZERO-H, the share of BF-BOF would be reduced to 34% in 2060, with 45% electric arc furnace and 21% hydrogen-DRI, and clean hydrogen would supply 29% of total final energy demand in the sector. With the grid price for solar and wind power expected to decline to US$38–40MWh−1 in 205019, the cost of green hydrogen
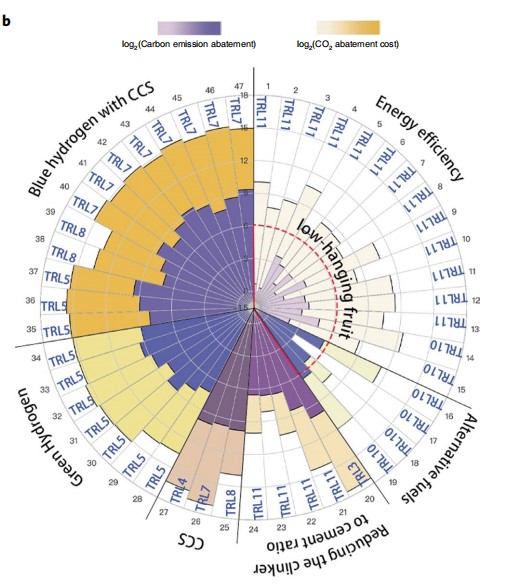
will also decline, and the 100% hydrogen-DRI route may play a more important role than previously recognized. Regarding cement production, the model includes 47 key mitigation technologies across the production processes classified into six categories (Supplementary Tables 2 and 3): energy efficiency, alternative fuels, reducing the clinker-to-cement ratio, CCUS, green hydrogen and blue hydrogen (Fig. 2b). Results show that improved energy efficiency technologies can reduce only 8–10% of the total CO2 emissions in the cement sector, and waste-heat cogeneration and oxy-fuel technologies will have limited mitigation effect (4–8%). Technologies to reduce the clinker-to-cement ratio can yield relatively high carbon mitigation (50–70%), mainly including decarbonized raw materials for clinker production using granulated blast furnace slag, although critics question if the resulting cement will retain its essential qualities. But current results indicate that utilization of hydrogen together with CCUS could help the cement sector achieve near-zero CO2 emissions in 2060.
In the ZERO-H scenario, 20 hydrogen-based technologies (out of the 47 mitigation technologies) come into play in cement production. We find that the average carbon abatement cost of hydrogen technologies is lower than typical CCUS and fuel switching approaches (Fig. 2b). Furthermore, green hydrogen is expected to be cheaper than blue hydrogen after 2030 as discussed in detail below, at around US$0.7–US$1.6 kg−1 H2 (ref. 20), bringing significant CO2 reductions in the provision of industrial heat in cement making. Current results show that it can reduce 89–95% of the CO2 from the heating process in China’s industry (Fig. 2b, technologies
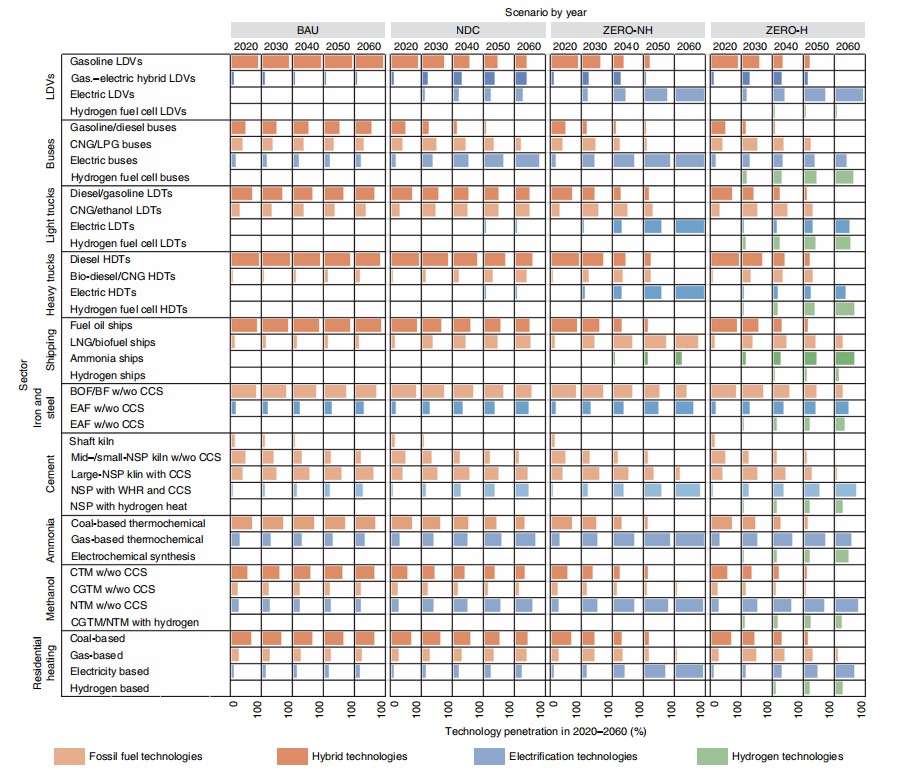
28–47), which is consistent with the Hydrogen Council’s estimate of 84–92% (ref. 21). Clinker process emissions of CO2 must be abated by CCUS in both ZERO-H and ZERO-NH. We also simulate use of hydrogen as a feedstock in production of ammonia, methane, methanol and other chemicals listed in the model description. In the ZERO-H scenario, gas-based ammonia production with hydrogen heat will gain a 20% share of total production in 2060 (Fig. 3 and Supplementary Table 4). The model includes four kinds of methanol production technologies: coal to methanol (CTM), coke gas to methanol (CGTM), natural gas to methanol (NTM) and CGTM/NTM with hydrogen heat. In the ZERO-H scenario, CGTM/NTM with hydrogen heat can achieve a 21% production share in 2060 (Fig. 3). Chemicals are also potential energy carriers of hydrogen. On the basis of our integrated analysis, hydrogen can comprise 17% of final energy consumption for heat provision in the chemical industry by 2060. Along with bioenergy (18%) and electricity (32%), hydrogen has a major role to play in
decarbonization of China’s HTA chemical industry (Fig. 4a).
Fig. 2 | Carbon mitigation potential and abatement costs of key mitigation technologies. a, Six categories of 60 key steelmaking emissions mitigation technologies. b, Six categories of 47 key cement emissions mitigation technologies. The technologies are listed by number, with corresponding definitions included in Supplementary Table 1 for a and Supplementary Table 2 for b. The technology readiness levels (TRLs) of each technology are marked: TRL3, concept; TRL4, small prototype; TRL5, large prototype; TRL6, full prototype at scale; TRL7,pre-commercial demonstration; TRL8, demonstration; TRL10, early adoption; TRL11, mature.
Decarbonizing HTA transportation modes with clean hydrogen On the basis of the modelling results, hydrogen also has large potential to decarbonize China’s transport sector, although it will take time. In addition to LDVs, other transport modes analysed in the model include fleet buses, trucks (light/small/medium/heavy), domestic shipping and railways, covering most transportation in China. For LDVs, electric vehicles look to remain cost competitive in the future. In ZERO-H, hydrogen fuel cell (HFC) penetration of the LDV market will reach only 5% in 2060 (Fig. 3). For fleet buses, however, HFC buses will be more cost competitive than electric alternatives in 2045 and comprise 61% of the total fleet in 2060 in the ZERO-H scenario, with the remainder electric (Fig. 3). As for trucks, the results vary by load rate. Electric propulsion will drive more than half of the total light-duty truck fleet by 2035 in ZERO-NH. But in ZERO-H, HFC light-duty trucks will be more competitive than electric light-duty trucks by 2035 and comprise 53% of the market by 2060. Regarding heavy-duty trucks, HFC heavy-duty trucks would reach 66% of the market in 2060 in the ZERO-H scenario. Diesel/bio-diesel/CNG (compressed natural gas) HDVs (heavy-duty vehicles) will quit the market after 2050 in both ZERO-NH and ZERO-H scenarios (Fig. 3). HFC vehicles have an additional advantage over electric vehicles in their better performance in cold conditions, important in northern and western China. Beyond road transport, the model shows widespread adoption of hydrogen technologies in shipping in the ZERO-H scenario. China’s domestic shipping is very energy intensive and an especially difficult decarbonization challenge. Clean hydrogen, especially as a
feedstock for ammonia, provides an option for shipping decarbonization. The least-cost solution in the ZERO-H scenario results in 65% penetration of ammonia-fuelled and 12% of hydrogen-fuelled ships in 2060 (Fig. 3). In this scenario, hydrogen will account for an average of 56% of the final energy consumption of the entire transport sector in 2060. We also modelled hydrogen use in residential heating (Supplementary Note 6), but its adoption is negligible and this paper focuses on hydrogen use in HTA industries and heavy-duty transport. Cost savings of carbon neutrality using clean hydrogen China’s carbon-neutral future will be characterized by renew able energy dominance, with a phasing out of coal in its primary energy consumption (Fig. 4). Non-fossil fuels comprise 88% of the primary energy mix in 2050 and 93% in 2060 under ZERO-H.Wind and solar will supply half of primary energy consumption in 2060. On average, nationally, the clean hydrogen share of total final energy consumption (TFEC) could reach 13% in 2060. Considering regional heterogeneity of production capacities in key industries by region (Supplementary Table 7), there are ten provinces with hydrogen shares of TFEC higher than the national average, including Inner Mongolia, Fujian, Shandong and Guangdong, driven by rich solar and onshore and offshore wind resources and/or multiple industrial demands for hydrogen. In the ZERO-NH scenario, the cumulative investment cost to achieve carbon neutrality up to 2060 would be $20.63 trillion, or 1.58% of the aggregate gross domestic product (GDP) for 2020–2060. The average additional investment on an annual basis would be around US$516 billion per year. This result is consistent with China’s US$15 trillion mitigation plan up to 2050, an average annual new investment of US$500 billion (ref. 22). However, introducing clean hydrogen options into China’s energy system and industrial feedstocks in the ZERO-H scenario results in a significantly lower cumulative investment of US$18.91 trillion by 2060 and the annual investment would be reduced to less than 1% of GDP in 2060 (Fig.4). Regarding the HTA sectors, the annual investment cost in those sectors would be around US$392 billion per year in the ZERO-NH scenario, which is consistent with the projection of the Energy Transition Commission (US$400 billion) (ref. 23). However, if clean
hydrogen is incorporated into the energy system and chemical feedstocks, the ZERO-H scenario indicates the annual investment cost in HTA sectors could be reduced to US$359 billion, chiefly by reducing reliance on costly CCUS or NETs. Our results suggest that the use of clean hydrogen can save US$1.72 trillion in investment cost and avoid a 0.13% loss in the aggregate GDP (2020–2060) compared with a pathway without hydrogen up to 2060.
Fig. 3 | Technology penetration in typical HTA sectors. Results under BAU, NDC, ZERO-NH and ZERO-H scenarios (2020–2060). In each milestone year,the specific technology penetration in different sectors is shown by the coloured bars, where each bar is a percentage of penetration up to 100% (for a fully shaded lattice). The technologies are further classified by different types (shown in the legends). CNG, compressed natural gas; LPG, liquid petroleum gas; LNG, liquid natural gas; w/wo, with or without; EAF, electric arc furnace; NSP, new suspension preheater dry process; WHR, waste heat recovery.
Post time: Mar-13-2023